| About | Trends | Codebooks | Resources | PolicyAgendasProject | LegSim | Thanks |

Trends in Bill Sponsorship Activity
If you are interested in a dynamic visualization of congressional lawmaking from 1973 to the present, please visit Legislative Explorer (legex.org).
This page highlights some noteworthy (and limited) trend information that may help to inform studies congressional bill activity. We also reference a few studies along the way. Some additional studies can be found in the bibliographies of the papers posted on the Resources page of this website but we do not update it frequently.
Library of Congress' Resumes of Congressional Activity document sponsorship activity by Congress from 1947 to the present.
Bill Sponsorship Activity across Time1
Bill sponsorship activity in the House peaked in the early 1970s, with nearly 20,000 bills introduced per Congress, compared to just 5,000 bills today. Much of this trend can be attributed to changes in House rules relating to cosponsorship. Cosponsorship was not allowed until the 91st Congress, when it was limited to 25 cosponsors per bill. A rules change in the 96th Congress (1977-78) eliminated this cap altogether. The incentive ti sponsor bills for postion-taking purposes was stronger prior to these reforms and, not surprisingly, sponsorship activity declines after these reforms, while success rates for legislation increases.
Cooper and Young's "Bill Introduction in the Nineteeth Century: A Study of Institutional Change" (Legislative Studies Quarterly 14 (1): 67-105. Very interesting historical perspective on bill introduction practices over time. For example, only committees could propose bills in the early congresses.
Cooper and Rybicki. 2002. "Analyzing Institutional Change: Bill Introduction in the Early Senate." in Bruce Oppenheimer, ed U.S. Senate Exceptionalism, 157-81.
Identical Bills and Cosponsorship Reforms 1
Prior to the 96th Congress, only 25 consponsors were permitted in the House. Prior to the 91st Congress, only on cosponsor was allowed. These reforms coincide with reductions in the number of bills introduced. Our hunch was that cosponsorship replaced bill sponsorship as a position-taking activity for many legislators. The effect should be that legislators would be less inclined to sponsor duplicate bills. Here we estimate the percent of all House bills that are duplicates by tagging those that have identical titles. As expected, this form of position-taking drops precipitously with the reforms.
Grofman and Beem also wrote on this subject in the early 1990s but without using individual bill data. "The effects of congressional rules about bill cosponsorship on duplicate bills: Changing incentives for credit claiming" Public Choice 75: 93-98.
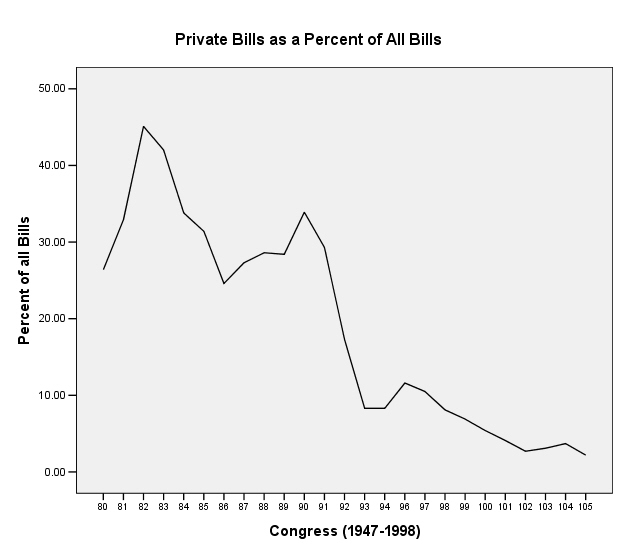
Private Bills 1
Private bills target the needs of particular individuals or organizations. The dataset includes a filter for private bills. In the early period, a very large proportion of all bills were private, in part because there were fewer public bills. Now, private bills represent a very small proportion of all bill introductions.
Hill, Jeffrey, and Kenneth Williams. 1993. The Decline of Private Bills: Resource Allocation, Credit Claiming, and the Decision to Delegate. American Journal of Political Science 37:1008-31.
Beth, Richard. 2004. Private Bills: Procedure in the House. CRS Report: 98-628
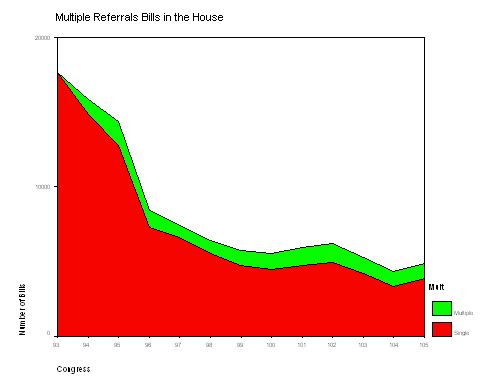
Multiple Referral1
Most bills (roughly 85%) are referred to just one standing committee in the House and multiple referrals are very rare in the Senate. In the House, multiple referral was formally allowed beginning in the 94th Congress but is still the exception to the rule
Davidson, Oleszek and Kephart. 1988. "One Bill, Many Committees: Multiple Referral in the House of Representatives. Legislative Studies Quarterly 13(1) 3-28.
Young and Cooper. 1993. "Multiple Referral and the Transformation of House Decision-making" in Dodd and Oppenheimer, Congress Reconsidered (5th Edition)
Sponsorship Activity in the 1st and 2nd Sessions of a Congress1
A large proportion of all the bills introduced in a Congress are submitted during the first weeks of the first session, probably because many are essentially reintroduced bills from the previous Congress. Paul Burstein et al. have an interesting article that examines the incubation time for policy ideas over multiple Congresses.
Paul Burstein et al's PRQ Article on tracing the progress of legislative ideas
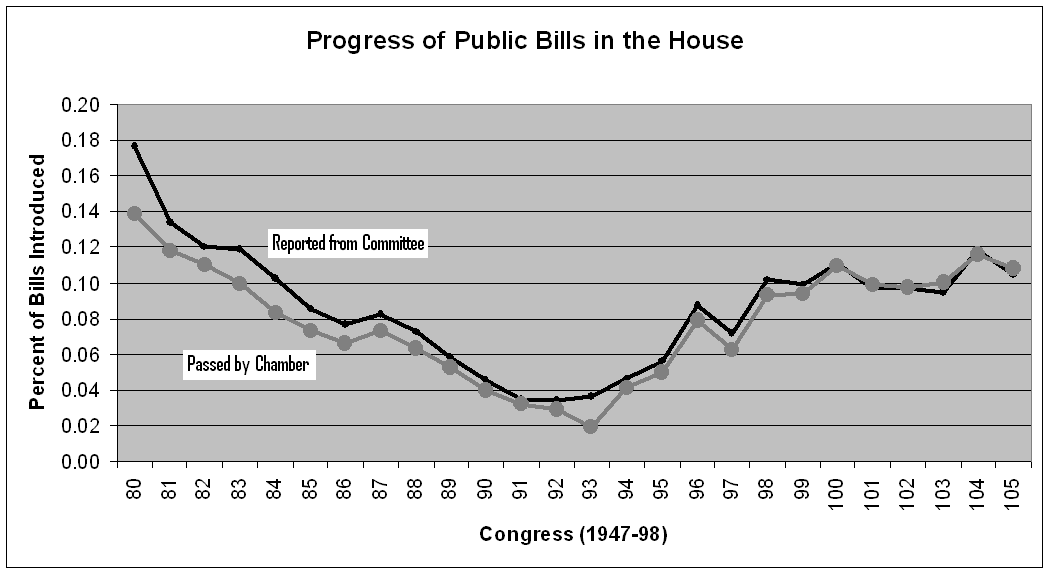
Bill Activity and Success:
Over Time 1
The percentage of bills reported or passed varies dramatically across congresses in part because of dramatic differences in the number of bills introduced.
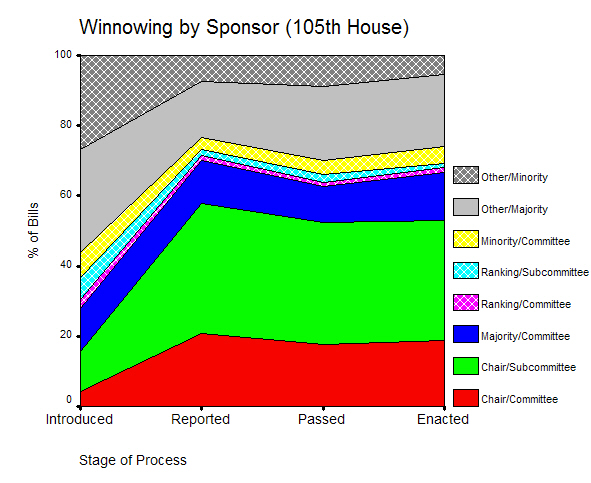
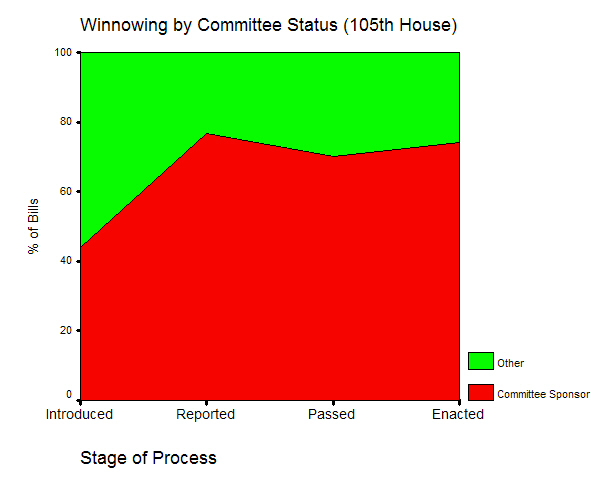
In these graphs, 'committee' refers to a bill that is sponsored by a member of the committee to which it was referred. 'Other' refers to bills sponsored by other members. Most successful bills are sponsored by committee of referral members, and by committee leaders in particular.
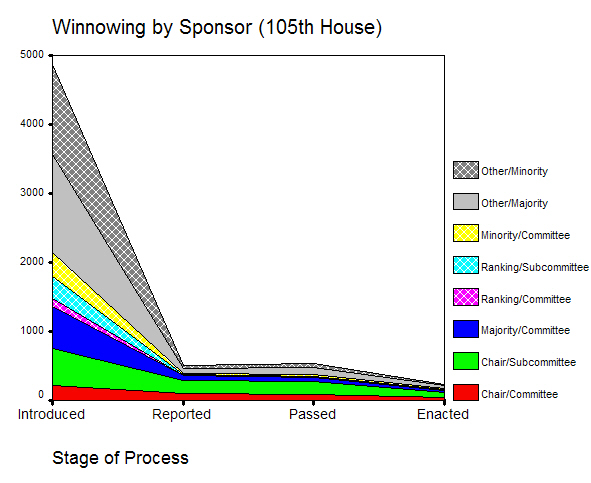
By Committee membership 3
Most of the bills reported from committee are sponsored by committee members. Most of these bills are sponsored by committee or subcommitee chairs. But it is also important to recognize that these trends vary by committee.
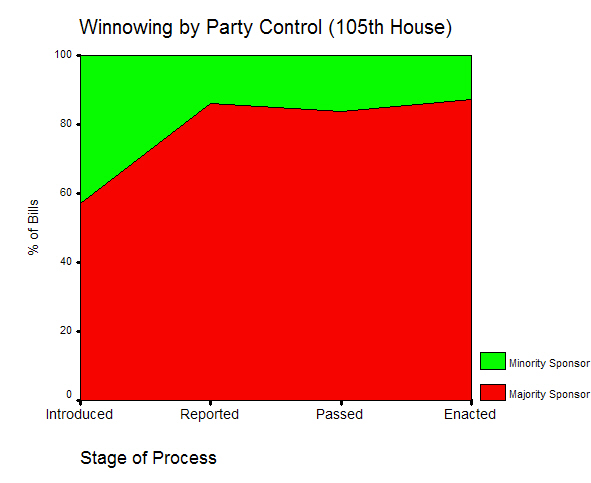
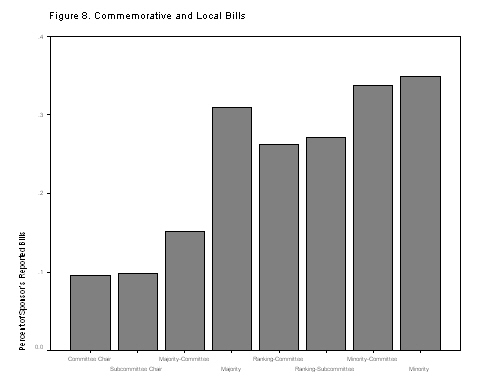
Not surprisingly, in both the House and Senate, the party in the majority sponsors the vast majority of successful bills. The prospects for minority party members look even bleaker when the substance of successful legislation is considered. A much larger proportion of minority members' limited successes involve bills that are either commemorative in content (e.g. the naming of a federal building), or are locally focused (e.g. public lands related).
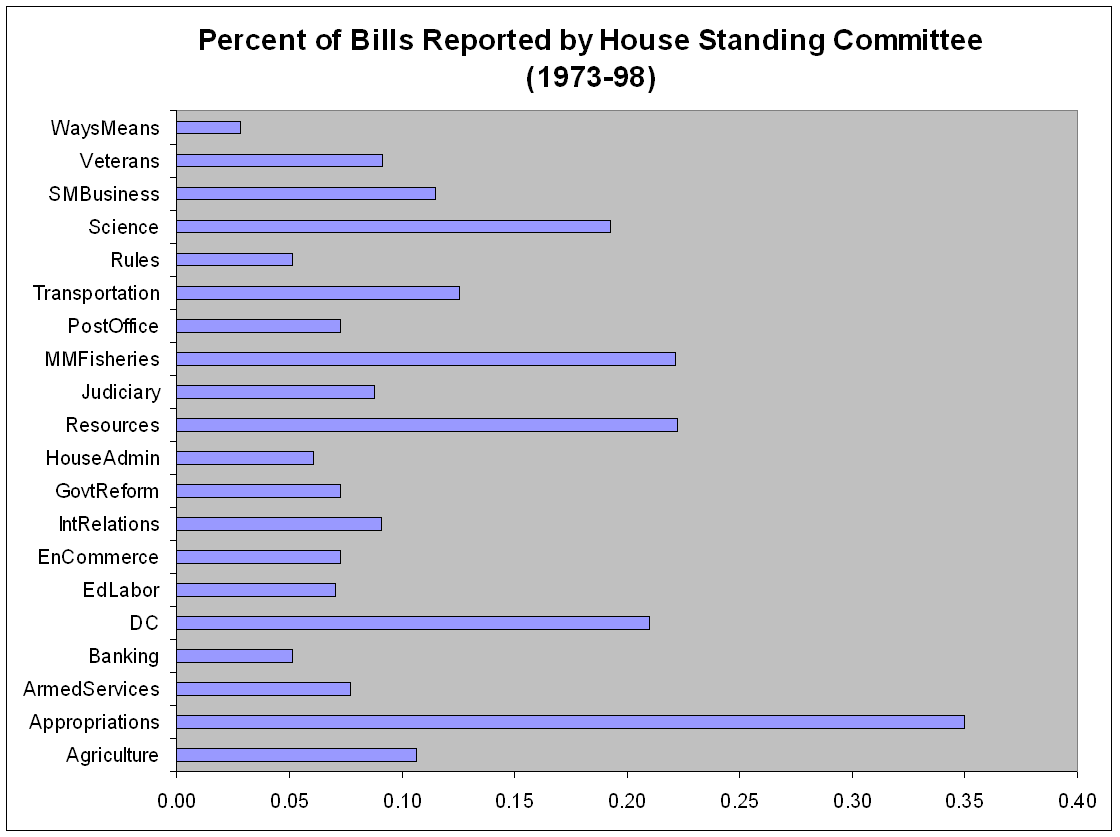
By Committee 1
Activity levels and success rates also vary by committee of jurisdiction. Appropriations and Ways & Means report few bills because both tend to concentrate their legislative efforts on a small number of omnibus vehicles. Ways and Means has a much lower success rate in part because members are encouraged to sponsor narrow bills authorizing specific changes to the tax code or temporarily suspending tarrifs that are then folded into a single larger bill.
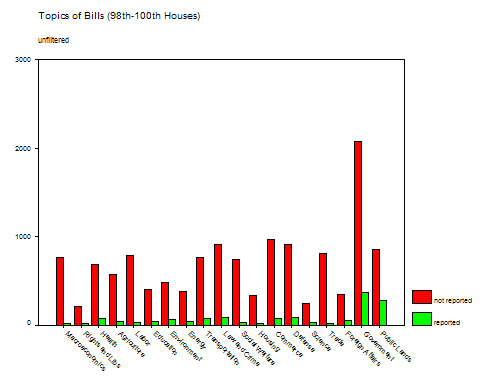
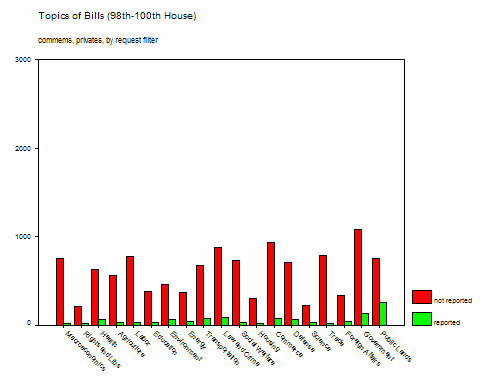
By Policy Topic 1 2
Another way to cut the data is to compare activity and success by topic. Some policy areas see more legislative activity than others, and the progress of bills also varies by policy topic. Ffiltering private and commemorative bills can alter these distributions substantially.
Types of Legislation
A bill is a tool that can be used to promote diverse goals (Schiller, AJPS, 1995). Bills are introduced for position-taking purposes, as the graph on the effects of the cosponsorship reforms illustrates.
Adler and Wilkerson's book, Congress and the Politics of Problem Solving (chapter 7) categorizes bills into three types - "must act, discretionary and minor" to show how bill sponsor success varies depending on the type of biill under consideration. In particular, nearly all must act bills (e.g. reauthorizations) are sponsored by committee leaders and these bills make up a substantial proportion of all legislation adopted. This helps to explain that high rates of committee success - in effect the issue agenda of Congress is largely driven by things Congress must do. Jack Walker made this observation in 1977 but it does not seem to have had much impact on how scholars have studied bill progress since then.
Please let us know how you are using these data (jwilker@u.washington.edu). We are also very interested in posting relevant papers that shed additional light on how bills can be used to study legislative policymaking on our resources page.